

Contents
Vietnam exported 345.42 billion USD worth of goods in the year to 15 August, up 22.2% or 62.64 billion USD on the same period last year, according to customs statistics. That is the headline. Break it down by commodity and two very different economies appear inside it: computers, electronic products and components alone added 31.18 billion USD of that growth, while textiles managed 1.1% and footwear 0.6%.
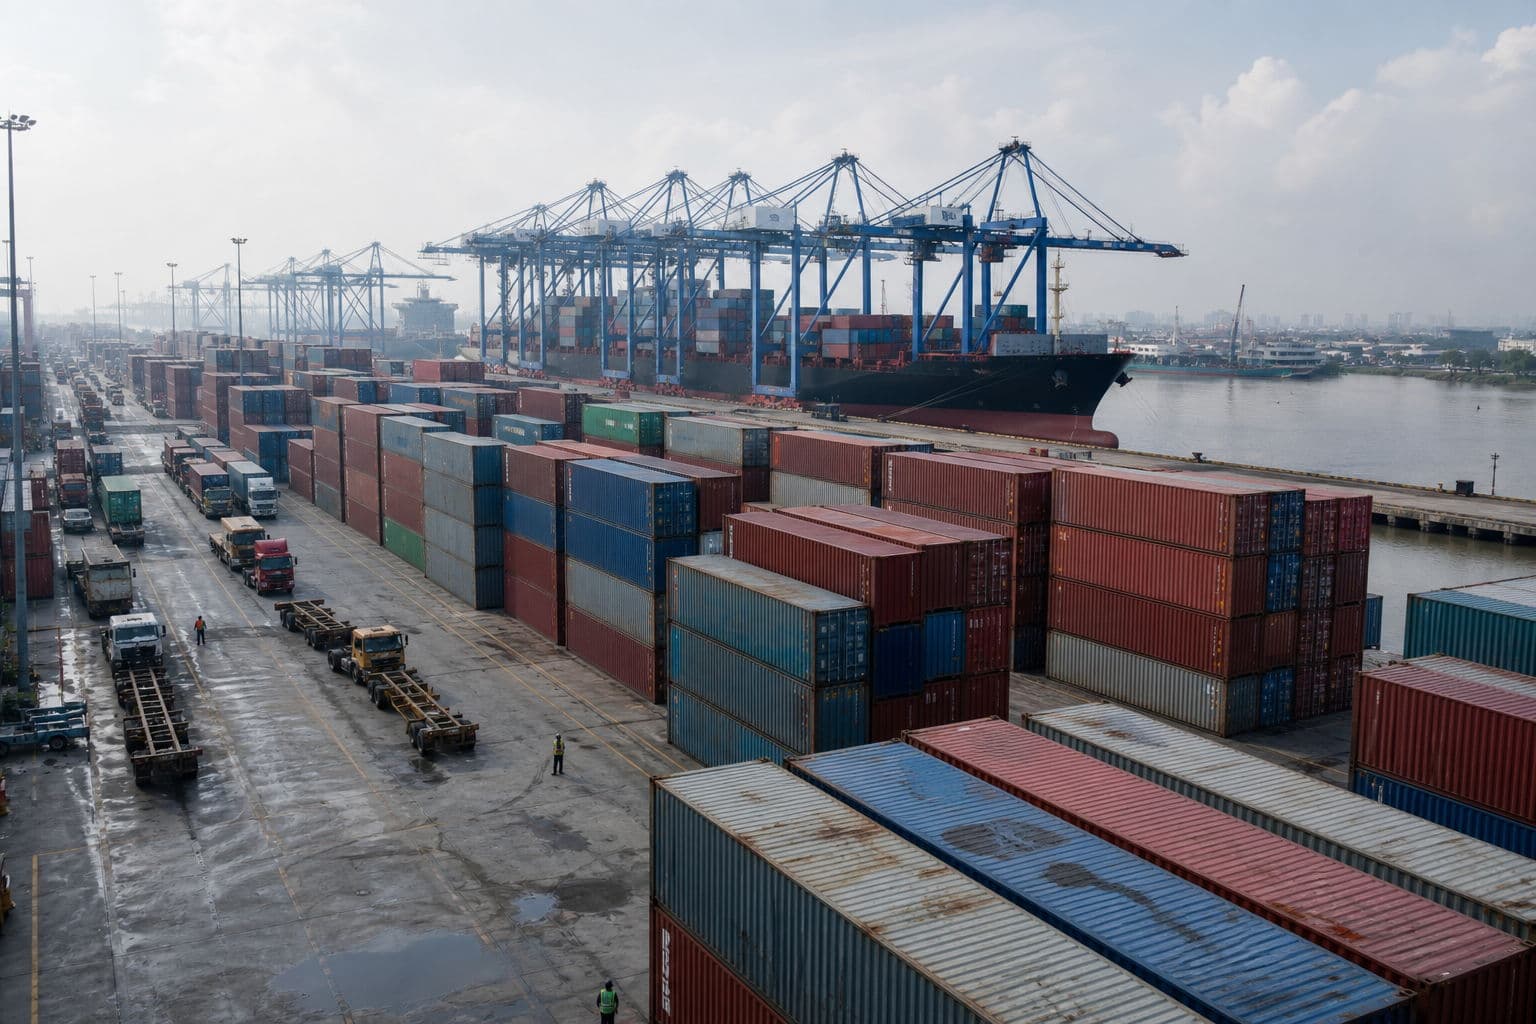
Exports at $345bn: foreign-invested firms drive the increase
Foreign-invested enterprises shipped 275.90 billion USD, up 58.45 billion USD or roughly 26.9%. Set the two figures against each other and the skew is stark. That group accounts for close to 80% of export turnover but more than 93% of the entire 62.64 billion USD increase. What is left, under 4.2 billion USD, is spread across every domestically owned exporter in the country.
Foreign-invested firms account for close to 80% of export turnover but more than 93% of the entire increase.
The three biggest lines all sit in manufacturing. Computers, electronic products and components reached 92.52 billion USD, up 31.18 billion USD or about 50.8%. Machinery, equipment and parts reached 43.42 billion USD, up 8.76 billion USD or about 25.3%. Phones and components reached 42.16 billion USD, up about 20.7%. The first two together contributed 39.94 billion USD of the total gain, close to two thirds of it. Hold this pace and the 550 billion USD full-year export target is within reach.
Imports are still running faster than exports
Two-way trade reached 712.72 billion USD by 15 August. Imports came to 367.30 billion USD, exceeding exports by 21.88 billion USD. Import value grew about 34% against 22.2% for exports, so imports recorded the faster growth rate. You can also consult the mid-July reading, while keeping cumulative totals separate from changes within each reporting period.
Electronics drives the inbound leg too. Imports of computers, electronic products and components hit 148.7 billion USD, up 66.8% and more than 56 billion USD above the export figure for the same category. Fuel and raw materials follow: petroleum products at 7.6 billion USD, up 72%, and coal at 6 billion USD, up 34%. Precious stones, precious metals and related products rose from 611 million USD to 1.97 billion USD, a 223% increase.
For shipping decisions, the electronics figures need a clear qualification: they measure trade value, not freight volume. The difference does not establish a capacity shortage from North East Asia or show that inbound space is as contested as outbound space. A practical approach is to check availability on each lane, then weigh cargo-ready dates against delivery deadlines before deciding when to book. The national totals cannot replace those shipment-level checks.
Impact by commodity
Textiles and footwear carry the sharpest contrast. Textiles reached 24.74 billion USD, up about 1.1%. Footwear reached 15.16 billion USD, up about 0.6%. With the whole export basket growing 22.2%, both sectors are running more than 21 percentage points behind the field. Those value figures do not establish whether order counts grew. For shipment planning, compare freight quotes, cut-offs and required delivery weeks to select an option suited to each order rather than treating slow export-value growth as evidence of a flat order book.
Coffee and rice both declined in export value. Coffee came in at 5.72 billion USD, down about 10%, and rice at 2.74 billion USD, down about 8.7%. Turnover alone cannot identify changes in shipment counts, cargo volumes or unit prices, nor establish that logistics costs take a larger share. You can compare LCL and FCL costs using actual volumes, delivery schedules and the cost of waiting to consolidate. A full container should be an option to evaluate, not an automatic recommendation.
Electronics and machinery recorded double-digit growth in export value, but these figures do not measure freight volumes or sea and air capacity. For planning purposes, plants can share quarterly forecasts with carriers and airfreight agents, then update them against actual production schedules. When consulting the analysis of US-lane freight rates, obtain a quote for your specific lane and intended shipping date rather than using a past market reading as a current offer.
Fuel-intensive operations should distinguish the 72% increase in petroleum import value from a change in fuel prices. It does not demonstrate that domestic trucking rates or container haulage surcharges have risen. For cost control, businesses preparing trucking contracts for Q4 2026 should check how the surcharge is calculated, what triggers an adjustment and when it takes effect. Confirm those terms with the haulier before signing rather than drawing a cost forecast from the import total.
Shipment planning for Q4 2026
- Textiles and footwear: request quotes for year-end departures and compare cut-offs and delivery weeks; export value is not a measure of order counts.
- Coffee and rice: compare LCL and FCL using actual cargo volumes, including consolidation waiting costs and delivery requirements.
- Electronics and machinery: share quarterly volume forecasts with carriers and airfreight agents, updating them against production schedules.
- Cargo inbound from North East Asia: check space by lane and cargo-ready date; electronics import value does not establish a capacity shortage.
- Trucking contracts for Q4 2026: review the calculation basis and adjustment terms for fuel surcharges before signing.
- Domestically owned exporters: compare your export-value growth with the 22.2% national figure, allowing for differences in commodity mix.
Homexim moves FCL and LCL ocean freight, airfreight, customs clearance and domestic trucking for Vietnamese importers and exporters. Send your lanes, commodity and expected fourth-quarter volume and we will come back with a space plan and a rate to match your shipping pattern.
Sources
Related service: Ocean freight FCL/LCL